Using Reports
Docs / Reports
Getting to grips with MultiQC reports
Using MultiQC Reports
Once MultiQC has finished, you should have a HTML report file called
multiqc_report.html (or something similar, depending on how you ran MultiQC).
You can launch this report with open multiqc_report.html on the command
line, or double clicking the file in a file browser.
Browser compatibility
MultiQC reports should work in any modern browser. They have been tested using OSX Chrome, Firefox and Safari. If you find any report bugs, please report them as a GitHub issue.
Report layout
MultiQC reports have three main page sections:
- The navigation menu (left side)
- Links to the different module sections in the report
- Click the logo to go to the top of the page
- The toolbox (right side)
- Contains various tools to modify the report data (see below)
- The report (middle)
- This is what you came here for, the data!
Note that if you’re viewing the report on a mobile device / small window, the content will be reformatted to fit the screen.
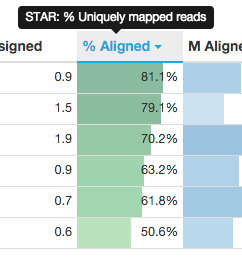
General Statistics table
At the top of every MultiQC report is the ‘General Statistics’ table. This shows an overview of key values, taken from all modules. The aim of the table is to bring together stats for each sample from across the analysis so that you can see it in one place.
Hovering over column headers will show a longer description, including which module produced the data. Clicking a header will sort the table by that value. Clicking it again will change the sort direction. You can shift-click multiple headers to sort by multiple columns.
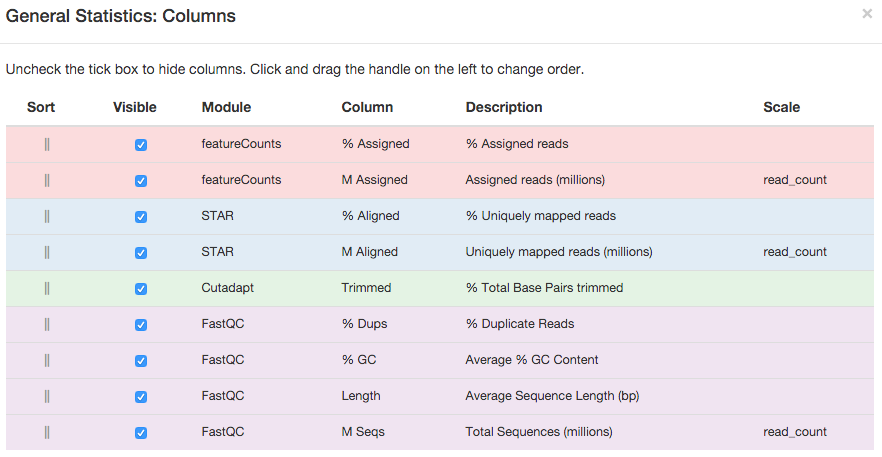
Above the table there is a button called ‘Configure Columns’. Clicking this will launch a modal window with more detailed information about each column, plus options to show/hide and change the order of columns.
Plots
MultiQC modules can take plot more extensive data in the sections below the general statistics table.
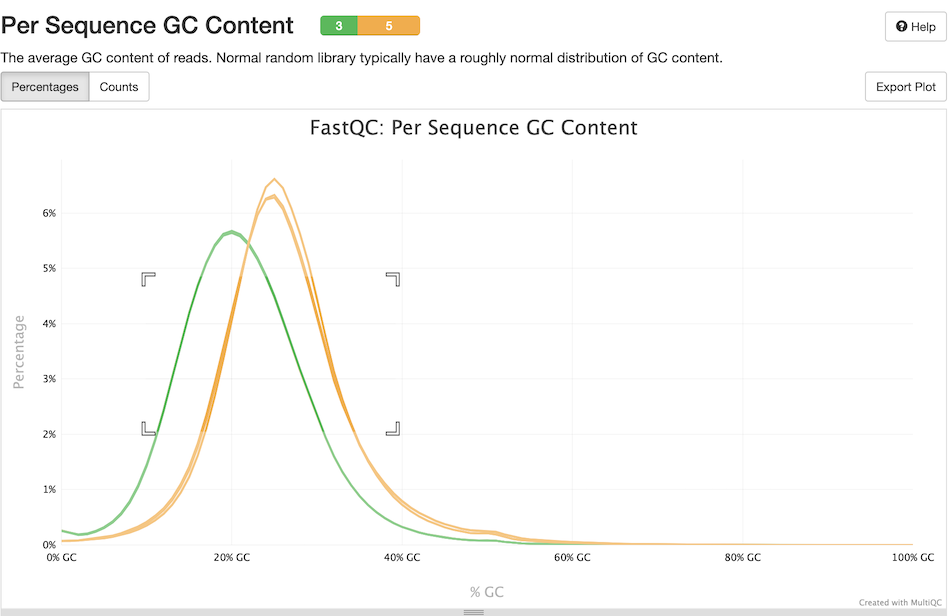
Interactive plots
Plots in MultiQC reports are usually interactive, using the Plotly JavaScript library.
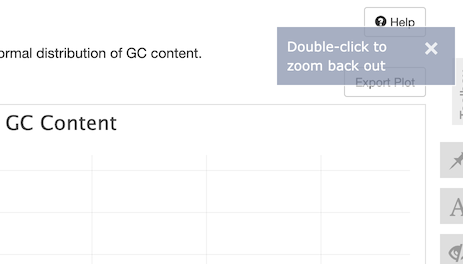
You can hover the mouse over data to see a tooltip with more information about that dataset. Clicking and dragging on the line graphs will zoom into that area.
To reset the zoom, use the button in the top right:
Plots have a grey bar along their base; clicking and dragging this will resize the plot’s height:
![]()
You can force reports to use interactive plots instead of flat by specifying
the --interactive command line option (see below).
Flat plots
Reports with large numbers of samples may contain flat plots. These are rendered when the MultiQC report is generated in Python using non-interactive (flat) images within the report. The reason for generating these are that large sample numbers can make MultiQC reports very data-intensive and unresponsive (crashing people’s browsers in extreme cases). Plotting data in flat images is scalable to any number of samples, however.
Flat plots in MultiQC have been designed to look as similar to their interactive
versions as possible. They are also copied to multiqc_data/multiqc_plots
You can force reports to use flat plots with the --flat command line option.
See the Large sample numbers docs for more on how to customise the flat / interactive plot behaviour.
Exporting plots
If you want to use the plot elsewhere (e.g. in a presentation or paper), you can export it in a range of formats. Just click the menu button in the top right of the plot:
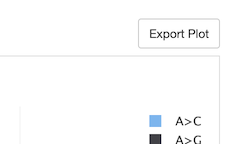
This opens the MultiQC Toolbox Export Plots panel with the current plot selected. You have a range of export options here. When deciding on output format bear in mind that SVG is a vector format, so can be edited in tools such as Adobe Illustrator or the free tool Inkscape. This makes it ideal for use in publications and manual customisation / annotation. The Plot scaling option changes how large the labels are relative to the plot.
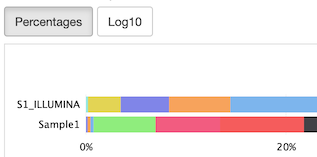
Dynamic plots
Some plots have buttons above them which allow you to change the data that they show or their axis. For example, many bar plots have the option to show the data as percentages instead of counts, or use a logarithmic scale:
Toolbox
MultiQC reports come with a ‘toolbox’, accessible by clicking the buttons on the right hand side of the report:
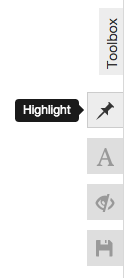
Active toolbox panels have their button highlighted with a blue outline.
You can hide the toolbox by clicking the open panel button a second time,
or pressing Escape on your keyboard.
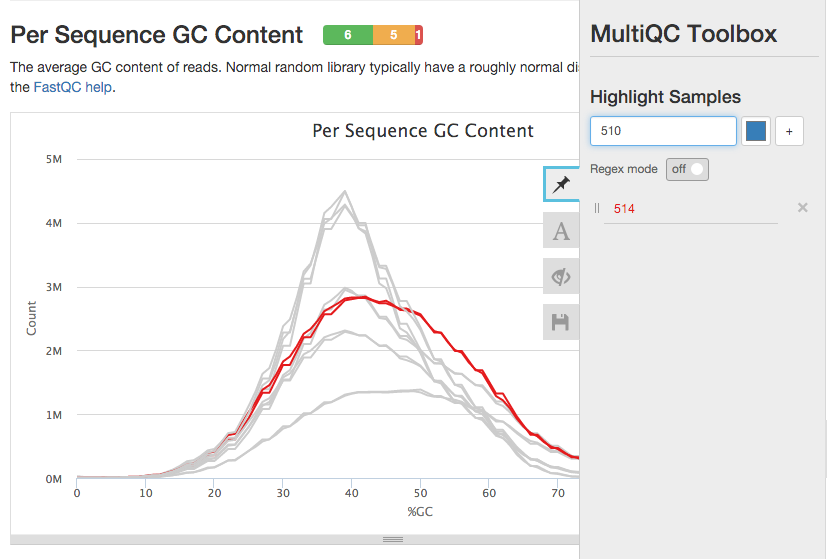
Highlight Samples
If you run MultiQC plots with a lot of samples, plots can become very data-heavy. This makes it difficult to find specific samples, or subsets of samples.
To help with this, you can use the Highlight Samples tool to colour datasets of interest. Simply enter some text which will match the samples you want to highlight and press enter (or click the add button). If you like, you can also customise the highlight colour.
To make it easier to match groups of samples, you can use a regular expressions
by turning on ‘Regex mode’. You can test regexes using a nice tool at
regex101.com. See a nice introduction to regexes
here. Note that pattern
delimiters are not needed (use pattern, not /pattern/).
Here, we highlight any sample names that end in _1:
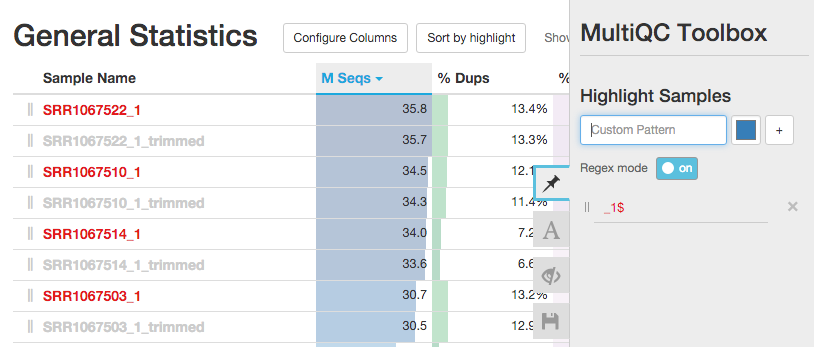
Note that a new button appears above the General Statistics table when samples are highlighted, allowing you to sort the table according to highlights.
Search patterns can be changed after creation, just click to edit. To remove, click the grey cross on the right hand side.
Searching for an empty string will match all samples.
Renaming Samples
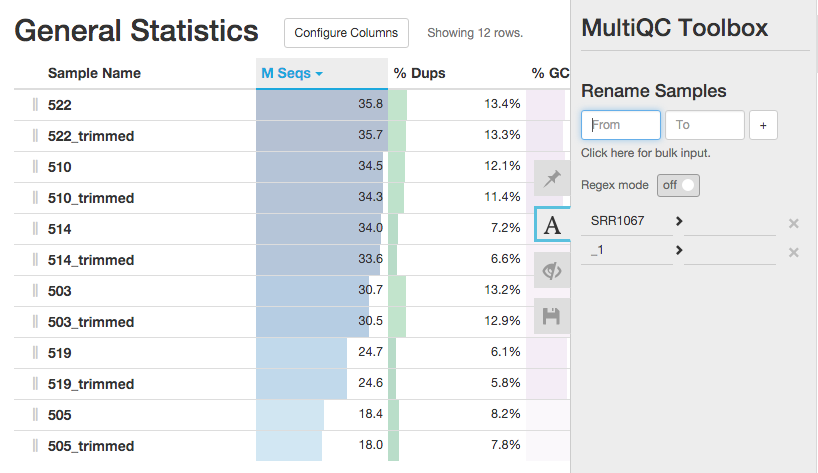
Sample names are typically generated based on processed file names. These
file names are not always informative. To help with this, you can do a search
and replace within sample names. Here, we remove the SRR1067 and _1 parts
of the sample names, which are the same for all samples:
Again, regular expressions can be used. See above for details. Note that
regex groups can be used - define a group match with parentheses and
use the matching value with $1, $2 etc. For example - a search string
SRR283(\d{3}) and replace string $1_SRR283 would move the final three
digits of matching sample names to the start of the name.
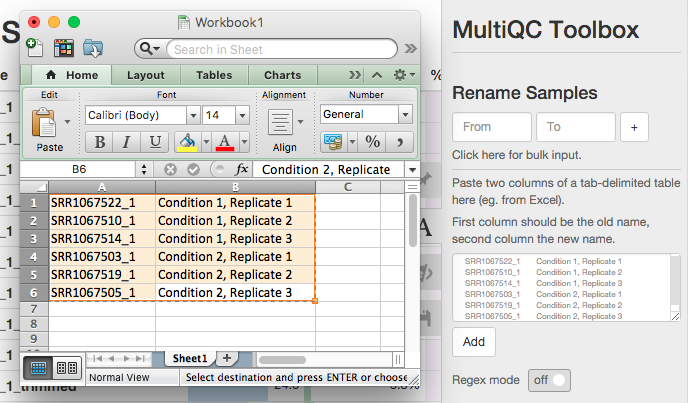
Often, you may have a spreadsheet with filenames and informative sample names. To avoid having to manually enter each name, you can paste from a spreadsheet using the ‘bulk import’ tool:
Hiding Samples
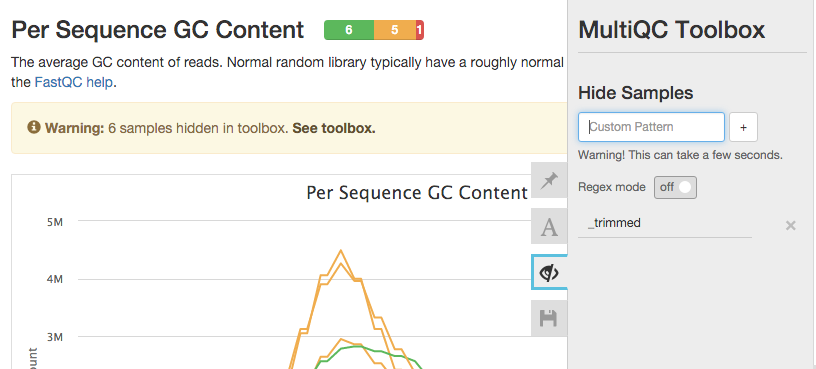
Sometimes, you want to focus on a subset of samples. To temporarily hide samples from the report, enter a search string as described above into the ‘Hide Samples’ toolbox panel.
Here, we hide all samples with _trimmed in their sample name:
(Note that plots will tell you how many samples have been hidden)
Export
This panel allows you to download MultiQC plots as images or as raw data. You can configure the size and characteristics of exported plot images: Width and Height set the output size of the images, scale sets how “zoomed-in” they should look (typically you want the plot to be more zoomed for printing). The tick boxes below these settings allow you to download multiple plots in one go.
Plots with multiple tabs will all be exported as files when using the Data tab. For plots with multiple tags, the currently visible plot will be exported.
You can also save static plot images when you run MultiQC. See Exporting Plots for more information.
Save Settings
To avoid having to re-enter the same toolbox setup repeatedly, you can save your settings using the ‘Save Settings’ panel. Just pick a name and click save. To load, choose your set of settings and press load (or delete). Loaded settings are applied on top of current settings. All configs are saved in browser local storage - they do not travel with the report and may not work in older browsers.