Customising Reports
Docs / Reports
Making MultiQC reports bespoke for your use case
Customising Reports
MultiQC offers a few ways to customise reports to easily add your own branding and some additional report-level information. These features are primarily designed for core genomics facilities.
Note that much more extensive customisation of reports is possible using custom templates.
Titles and introductory text
You can specify a custom title for the report using the -i/--title
command line option. The -b/--comment option can be used to add a
longer comment to the top of the report at run time.
You can also specify the title and comment, as well as a subtitle and the introductory text in your config file:
title: "My Title"
subtitle: "A subtitle to go underneath in grey"
intro_text: "MultiQC reports summarise analysis results."
report_comment: "This is a comment about this report."
Note that if intro_text is None the template will display the default
introduction sentence. Set this to False to hide this, or set it to a
string to use your own text.
Report time and analysis paths
It’s not always appropriate to include the file paths that MultiQC was run with in a report, for example if sharing reports with others outside your organisation.
If you wish, you can disable the analysis paths and/or time in the report header with the following config parameters:
show_analysis_paths: False
show_analysis_time: False
Report Logo
To add your own custom logo to reports, you can add the following three lines to your MultiQC configuration file:
custom_logo: "/abs/path/to/logo.png"
custom_logo_url: "https://www.example.com"
custom_logo_title: "Our Institute Name"
Only custom_logo is needed. The URL will make the logo open up
a new web browser tab with your address and the title sets the mouse
hover title text.
Project level information
You can add custom information at the top of reports by adding key
pairs to the config optionreport_header_info. Note that if you have
a file called multiqc_config.yaml in the working directory, this will
automatically be parsed and added to the config. For example, if you have
the following saved:
report_header_info:
  - Contact E-mail: "phil.ewels@seqera.io"
  - Application Type: "RNA-seq"
  - Project Type: "Application"
  - Sequencing Platform: "HiSeq 2500 High Output V4"
  - Sequencing Setup: "2x125"
Then this will be displayed at the top of reports:
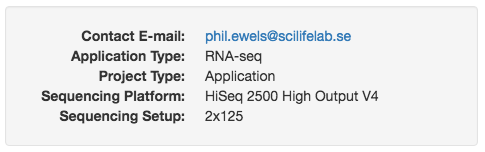
Note that you can also specify a path to a config file using -c.
Listing software versions
If a software tool prints its version number in log output, MultiQC attempts to find this information and print it in reports (see Saving version information) for module developer documentation. However, not all tools make version information available in their log files. Additionally, some situations may require bespoke version number reporting, for example if software is found within multiple scopes in an analysis pipeline.
In these cases, you can manually add software version information to a report. This can be done in two different ways: by adding them in to the MultiQC configuration, or by creating stand-alone YAML files with specific filenames and formats.
Both methods have the same syntax for the YAML configuration, with the exception
of MultiQC configuration files requiring a top-level software_versions.
The examples below are for a MultiQC config file.
If a provided software name exactly matches the name of a module that ran (case insensitive), then the version number(s) will be shown alongside the section heading. All software versions will be printed at the bottom of the report. This is the same behaviour as version numbers found within log files.
Option 1: Dictionary of software name and version pairs
The simplest way to provide version numbers to give names and versions:
software_versions:
  samblaster: "0.1.24"
quast: "5.2.0"Make sure that you write the version in quotes to ensure it being
interpreted as a string. For example, a version 1.10 without
quotes would be parsed as a float and displayed as version 1.1.
If you have run a tool multiple times and have multiple software versions, you can provide a list of versions:
software_versions:
  samblaster: "0.1.24"
  quast:
    - "5.2.0"
    - "5.1.0"
Option 2: Grouping softwares and versions
In more complex scenarios, you may have multiple version names that you want to group. For example, a tool that wraps other tools, or listing software version numbers grouped by analysis pipeline step.
Here, input is provided as a nested YAML dictionary with three levels:
group -> software(s) -> version(s).
software_versions:
  samtools:
    samtools: "1.11"
    htslib: "1.3"
  quast:
    quast:
      - "5.2.0"
- "5.1.0"software_versions:
analysis_stage_1:
samtools: "1.3"
htslib: "1.3"
analysis_stage_2:
samtools: "1.11"
htslib: "1.11"
analysis_stage_3:
quast:
- "5.2.0"
- "5.1.0"If a group and software have the same name (eg. samtools -> samtools),
the software name will not be repeated in the section header.
Software versions YAML file
If you prefer to provide versions in a separate YAML file, MultiQC will also
look for filenames ending in *_mqc_versions.(yml|yaml) in your search path,
for example rnaseq_mqc_versions.yml or mapping_mqc_versions.yaml. The
content of these YAML files should be a YAML dictionary, similar to the
previous examples but without the top level software_versions. For example:
samblaster: "0.1.24"
quast:
  - "5.2.0"
  - "5.1.0"
some_other_tool: "2023-1"
If multiple YAML files are found the content of these will be merged together.
Disabling automatic versions
In some applications, such as a pipeline workflow, you may wish to only include version information defined in the config file or in a separate YAML file. For this, it possible to disable parsing versions from the log file through the following config option:
disable_version_detection: trueDisabling software version report section
If you like, you can remove the Software Versions report section. Software versions will still be shown inline with the headings, where possible. To do this, use the following config option:
skip_versions_section: trueNote that setting this in combination with manually added version numbers could lead to versions not being included within the report.
Customize software versions table header
In the Software Versions report section the default table header for the column, listing groups of software, is “Group”. This can be changed by setting the config option versions_table_group_header to your desired header name. For example:
versions_table_group_header: "Analysis Pipeline Step"Sample name replacement
Occasionally, when you run MultiQC you may know that you want to change the resulting
sample names at run time. You can do this using the --replace-names option, which
allows you to change sample names during report creation.
Unlike --sample-names below, the original names never make it through to the report.
This can be useful if you know that you have a range of outputs that result in varying
sample names but want to create a consistent report - especially if you want
samples to line up properly in the General Statistics table.
To use, create a tab-separated file with two columns. The first column contains the search strings and the second the replacement strings:
IDX102934	Sample_1
IDX102935	Sample_2
IDX102936	Sample_3
Note that by default, partial matches are replaced. So if a log file gives a sample
name of IDX102934_mytool then the result will be Sample_1_mytool.
There are two config options to fine-tune this behaviour:
Setting sample_names_replace_exact to True in a MultiQC config file will tell
MultiQC to only change a sample name if the pattern fully matches the search string.
In the above example, IDX102934_mytool would remain unchanged.
Setting sample_names_replace_complete to True, the replacement string will be used
as a complete replacement if the search pattern matches at all.
In the above example, IDX102934_mytool would become Sample_1.
Use this method with caution! If aggressive cleaning of sample names results in multiple samples with identical identifiers, they will be overwritten.
To have more control over replacements, you can use regular expressions.
If you set sample_names_replace_regex to True in a MultiQC config file
and then create a file that contains regex search strings and even Python regex
group identifiers in the replace string. For example:
SAMPLE(\d)_([PS]E)_(\d) XXX_\1_\2_\3With this file, SAMPLE1_PE_2 would be renamed to XXX_1_PE_2.
SAMPLE3_SE_4 would be renamed to XXX_3_SE_4.
Setting sample_names_replace_exact to True also works for regular expression
searches. The code uses the re.fullmatch function, so no ^ or $ anchors are needed.
Setting sample_names_replace_complete is ignored when using regexes.
If you want this behaviour then configure your regular expression to match the entire string.
For example, *(\d)_([PS]E)_(\d) \1_\2_\3 would rename SAMPLE1_PE_2 to 1_PE_2.
Finally, if you prefer not to use --replace-names with a TSV file, you
can set the search patterns in a MultiQC config file directly.
For example:
sample_names_replace:
  IDX102934: Sample_1
  IDX102935: Sample_2
  IDX102936: Sample_3
Remember that backslashes must be escaped in YAML. So if using regular expressions you will need to use double-backslashes. You may also need to quote strings:
sample_names_replace_regex: True
sample_names_replace:
  "SAMPLE(\\d)_([PS]E)_(\\d)": "XXX_\\1_\\2_\\3"
Bulk sample renaming in reports
Although it is possible to rename samples manually and in bulk using the report toolbox, it’s often desirable to embed such renaming patterns into the report so that they can be shared with others. For example, a typical case could be for a sequencing centre that has internal sample IDs and also user-supplied sample names. Or public sample identifiers such as SRA numbers as well as more meaningful names.
It’s possible to supply a file with one or more sets of sample names using the --sample-names
command line option. This file should be a tab-delimited file with a header row (used for
the report button labels) and then any number of renamed sample identifiers. For example:
MultiQC Names	Proper Names	AWESOME NAMES
SRR1067503_1	Sample_1	MYBESTSAMP_1
SRR1067505_1	Sample_2	MYBESTSAMP_2
SRR1067510_1	Sample_3	MYBESTSAMP_3
If supplied, buttons will be generated at the top of the report with your labels. Clicking these will populate and apply the Toolbox renaming panel.
Sample renaming works with partial substrings - these will be replaced!
It’s also possible to supply such renaming patterns within a config file (useful if you’re
already generating a config file for a run). In this case, you need to set the variables
sample_names_rename_buttons and sample_names_rename. For example:
sample_names_rename_buttons:
  - "MultiQC Names"
  - "Proper Names"
  - "AWESOME NAMES"
sample_names_rename:
  - ["SRR1067503_1", "Sample_1", "MYBESTSAMP_1"]
  - ["SRR1067505_1", "Sample_2", "MYBESTSAMP_2"]
  - ["SRR1067510_1", "Sample_3", "MYBESTSAMP_3"]
Show / Hide samples buttons
It is possible to filter which samples are visible through the report toolbox, but it can be desirable to embed such patterns into the report so that they can be shared with others. One example can be to add filters for batches, to easily scan if certain quality metrics overlap between these batches.
It’s possible to supply a file with one or more patterns to filter samples on using the
--sample-filters command line option. This file should be a tab-delimited file with each
row containing the button name, whether the pattern should be hidden (hide) or shown (show)
and the patterns to be applied (all subsequent columns). If you want to use a regular expression
pattern, opposed to the default globbing, you can use hide_re and show_re.
For example, to filter on read pair groups, you could use the following file:
Read Group 1	show	_R1
Read Group 2	show	_R2
Or in regex mode:
Read Group 1	show_re	.*_R1
Read Group 2	show_re	.*_R2
To filter on controls and sample groups you could use:
Controls	show	input_
Conditions	show	group_1_	group_2_	group_3_
MultiQC automatically adds an Show all button at the start, which reverts back to showing all samples.
If you prefer, you can also add these buttons using a MultiQC config file:
show_hide_buttons:
  - Read Group 1
  - Read Group 2
  - Controls
  - Conditions
show_hide_mode:
  - show
  - show
  - show
  - show
show_hide_patterns:
  - _R1
  - _R2
  - input_
  - ["group_1_", "group_2_", "group_3_"]
Module and section comments
Sometimes you may want to add a custom comment above specific sections in the report. You can
do this with the config option section_comments as follows:
section_comments:
  featurecounts: "This comment is for a module header, but should still work"
  star_alignments: "This new way of commenting above sections is **awesome**!"
Comments can be written in Markdown. The section_comments keys should correspond to the HTML IDs
of the report section. You can find these by clicking on a navigation link in the report and seeing
the #section_id at the end of the browser URL.
To add a section comment for General Statistics, use the ID general_stats.
Removing modules or sections
If you don’t want an entire module to be used in a MultiQC report, use the -e/--exclude
command line flags to skip running that tool. You can also use the config option exclude_modules:
exclude_modules:
  - fastqc
  - cutadapt
If you want to run only specific modules, you can do that with -m/--module or the
config option run_modules:
run_modules:
  - fastqc
  - cutadapt
If you would like to remove just one section of a module report, you can do so with the
remove_sections config option as follows:
remove_sections:
  - section-id-one
- second-section-idThe section ID is the string appended to the URL when clicking a report section in the navigation.
For example, the GATK module has a section with the title “Compare Overlap”. When clicking that
in the report’s left hand side navigation, the web browser URL has #gatk-compare-overlap
appended. Here, you would add gatk-compare-overlap to the remove_sections config.
Finally, you can prevent MultiQC from finding the files for a module or submodule by customising its search pattern. For example, to skip Picard Base Calling metrics, you could use the following:
sp:
  picard/collectilluminabasecallingmetrics:
    skip: true
The search pattern identifiers can be found in the documentation below for each module.
Removing General Statistics
The General Statistics is a bit of a special case in MultiQC, but there is added code to make it
behave well with the above mechanism. On the command line, you can specify -e general_stats.
Alternatively, you can set the following config flag in your MultiQC config:
skip_generalstats: trueOrder of modules
By default, modules are included in the report as in the order specified in config.module_order.
Any modules found which aren’t in this list are appended at the top of the report.
Top modules
To specify certain modules that should always come at the top of the report, you can configure
config.top_modules in your MultiQC configuration file. For example, to always have the FastQC
module at the top of reports, add the following to your ~/.multiqc_config.yaml file:
top_modules:
  - "fastqc"
Running modules multiple times
A module can be specified multiple times in either config.module_order or config.top_modules,
causing it to be run multiple times. By itself you’ll just get two identical report sections.
However, you can also supply configuration options to the modules as follows:
top_modules:
  - moduleName:
      name: "Module (filtered)"
      info: "This section shows the module with different files"
      path_filters:
        - "*_special.txt"
        - "*_others.txt"
  - moduleName:
      name: "Module (not-special)"
      path_filters_exclude:
        - "*_special.txt"
These overwrite the defaults that are hardcoded in the module code. path_filters and path_filters_exclude being the exception. These filter the file searches for a given list of glob filename patterns:
| Pattern | Meaning |
|---|---|
| * | matches everything |
| ? | matches any single character |
| [seq] | matches any character in seq |
| [!seq] | matches any character not in seq |
Note that exclusion superseeds inclusion for the path filters.
The other available configuration options are:
name: Section nameanchor: Section report IDtarget: Intro link texthref: Intro link URLinfo: Intro textextra: Additional HTML after intro.custom_config: Custom module-level settings. Translated intoconfig.moduleName, but specifically for this section.
For example, to run the FastQC module twice, before and after adapter trimming, you could use the following config:
module_order:
  - fastqc:
      name: "FastQC (trimmed)"
      anchor: "fastqc_trimmed"
      info: "This section of the report shows FastQC results after adapter trimming."
      target: ""
      path_filters:
        - "*_1_trimmed_fastqc.zip"
  - cutadapt
  - fastqc:
      name: "FastQC (raw)"
      anchor: "fastqc_raw"
      path_filters:
        - "*_1_fastqc.zip"
Note that if you change the name then you will get multiples of columns in the
General Statistics table. If unchanged, the topmost module may overwrite output from
the first iteration.
If you set a custom anchor, then this can be used for other configuration options.
For example, using the anchors above and the report_section_order described below:
report_section_order:
  fastqc_trimmed:
before: fastqc_rawCurrently, you can not list a module name in both top_modules and module_order.
Let me know if this is a problem..
Order of module and module subsection output
The module_order config changes the order in which each MultiQC module is executed.
However, sometimes it’s desirable to customise the order of specific sections in a report,
independent of the order of module execution. For example, the custom_content module can
generate multiple sections from different input files.
Also, module_order does not allow you to change the sequence of sections within a MultiQC module.
To change the order of MultiQC outputs, follow a link in a report navigation to skip to the section
you want to move (either a major section header or a subheading). Find the ID of that section by looking at the URL.
For example, clicking on FastQC changes the URL to multiqc_report.html#fastqc - the ID is
the text after (not including) the # symbol: fastqc.
The FastQC Status Checks subsection is multiqc_report.html#fastqc_status_checks and has the id fastqc_status_checks.
Next, specify the report_section_order option in your MultiQC config file. Modules and sections in
the report are given a number ranging from 10 (section at bottom of report), incrementing by +10
for each section. You can change this number (eg. a very low number to always get at the bottom
of the report or very high to always be at the top), or you can move a section to before or after
another existing section (has no effect if the other named ID is not in the report).
Note that module sub-sections can only be move within their module. So you can’t have the FastQC Adapter Content section shown under the GATK module header.
You can also use this config option to completely remove module sub-sections.
To do this, just set the subsection ID to remove (NB: no : or -).
This only works for module subsections. To remove an entire module, use the -e/--exclude flag.
For example, you could add the following to your MultiQC config file:
report_section_order:
  module_output_1:
    order: -1000
  module_output_2:
    after: "diffsection"
  mod_section_1:
    before: "othersection"
  mod_section_2: remove
Customising plots
Almost every plot in all MultiQC reports are created using standard plotting functions and a plot config. You can override any plot config variable you like for any plot to customise how these are generated.
To do this, first find the plot that you would like to customise and copy it’s unique ID. You can find this by clicking export - the name next to the checkbox is the ID.
Next, you need to find the plot config key(s) that you would like to change. You can find these by reading the MultiQC documentation below.
For example, to set a new limit for the Picard InsertSizeMetrics x-axis, you can use the following:
custom_plot_config:
  picard_insert_size:
    xmax: 300
You can customise multiple variables for multiple plots:
custom_plot_config:
  # Show the percentages tab by default for the FastQC sequence counts plot
  fastqc_sequence_counts_plot:
    cpswitch_c_active: False

  # Only show up to 20bp on the x axis for cutadapt, change the title
  cutadapt_plot:
    xmax: 20
    title: "How many base pairs have been removed from the data"

  # Add a coloured band in the background to show what is a good result
  # Yes I know this doesn't make sense for this plot, it's just an example ;)
  bismark_mbias:
    yPlotBands:
      - from: 0
        to: 40
        color: "#e6c3c3"
      - from: 40
        to: 80
        color: "#e6dcc3"
      - from: 80
        to: 100
        color: "#c3e6c3"
As of version 1.8, this also works for customising the config of bargraph categories:
custom_plot_config:
  bowtie1_alignment:
    reads_aligned:
      color: "#d84e2f"
    multimapped:
      color: "#f2e63f"
    not_aligned:
      color: "#8bbc21"
Customising tables
Much like with the custom plot config above, you can override almost any configuration options for tables. To see what’s available, read the documentation about Creating a table.
Tables have configuration at two levels:
- Entire table
- Affects all columns and data. These configs are the same as plot configs and can be overridden with
custom_plot_configas described in the Customising plots section.
- Affects all columns and data. These configs are the same as plot configs and can be overridden with
- Specific columns
- Table columns (headers) have their own configuration scope:
custom_table_header_config. See below.
- Table columns (headers) have their own configuration scope:
Config for an entire table
Here we are customising the Picard HSMetrics table. We’re setting a non-standard title for the first column (usually “Sample name”) and changing the minimum value for the colour scale for all columns.
Here min is a header config but we’re setting it at table config level.
This means it will be used as a default for all columns in the table, overwriting anything
that the module defines itself specifically for a given column.
custom_plot_config:
  picard_hsmetrics_table:
    col1_header: "Identifiers"
    min: 1000
Another example of how this can be used is to make all columns in the General Statistics table hidden by default:
custom_plot_config:
  general_stats_table:
    hidden: true
Config for a specific column
To change the number of decimals used in the General Statistics table for the single column Qualimap: Mean Coverage:
custom_table_header_config:
  general_stats_table:
    mean_coverage:
      format: "{:,.20f}"
The first key is the table ID, the second is the header ID for the column you want to change.
The easiest way to find these IDs is by clicking Configure Columns above the table you want to customise.
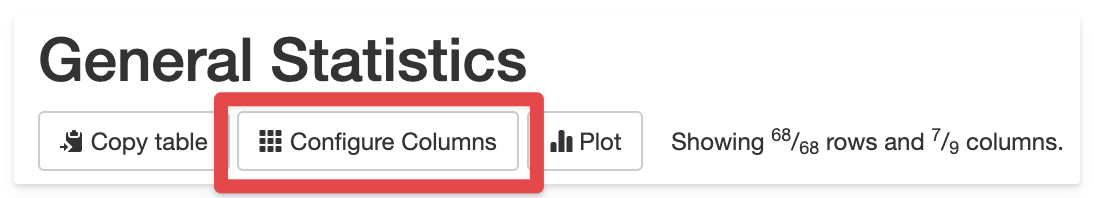
The table ID is shown at the top of the modal window. The ID column shows the column (header) ID.
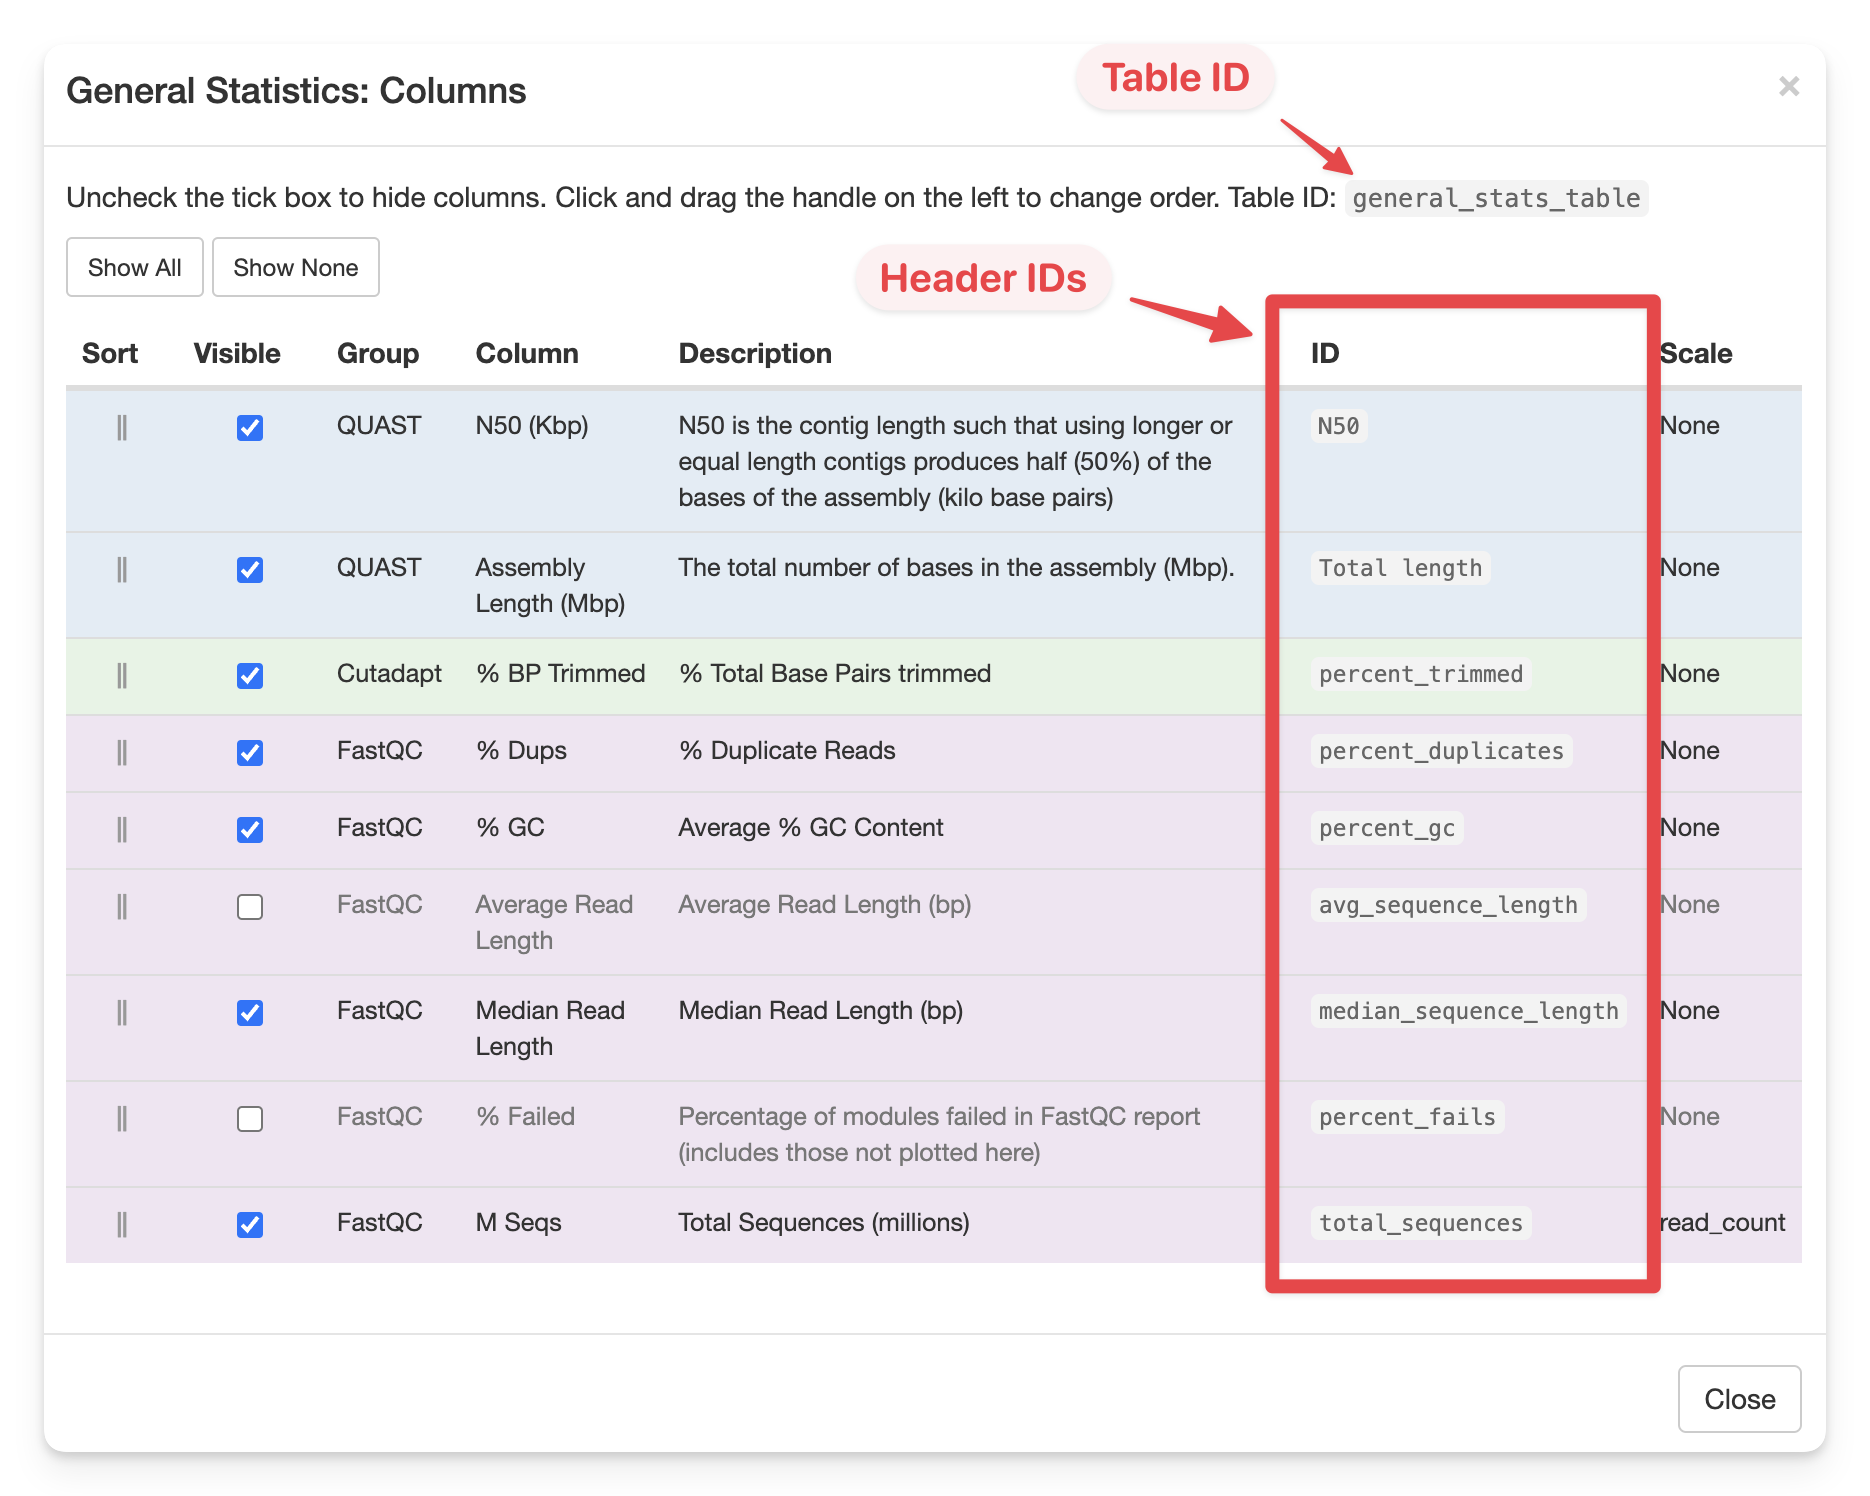
Hiding columns
Report tables such as the General Statistics table can get quite wide. To help with this, columns in the report can be hidden. Some MultiQC modules include columns which are hidden by default, others may be uninteresting to some users.
To allow customisation of this behaviour, the defaults can be changed by adding to your
MultiQC config file. This is done with the table_columns_visible value. Open a MultiQC
report and click Configure Columns above a table. Make a note of the Group and ID
for the column that you’d like to alter. For example, to make the % Duplicate Reads
column from FastQC hidden by default, the Group is FastQC and the ID is
percent_duplicates. These are then added to the config as follows:
table_columns_visible:
  FastQC:
    percent_duplicates: False
You can also specify a value for an entire module / table namespace. This will then show or hide all columns for that module. For example:
table_columns_visible:
  FastQC: False
Note that you can set these values to True to show columns that would otherwise be hidden
by default.
It can also be done for other module-specific tables in the report, where instead of
the Group, you’d need to specify the table ID. To get the table ID, click
Configure Columns above the table, and look for the first line above the table contents.
It should say something like “Uncheck the tick box … Table ID: quast_table“.
For example, to hide the # misassemblies column in the Assembly Statistics table from QUAST, you would use the following config:
table_columns_visible:
  quast_table:
    "# misassemblies": false
Or you can pass the column ID directly:
table_columns_visible:
  "# misassemblies": false
Column order
In the same way, you can force a column to appear at the start or end of the table, or
indeed impose a custom ordering on all the columns, by setting the table_columns_placement.
High values push columns to the right hand side of the table and low to the left. The default
value is 1000. For example:
table_columns_placement:
  Samtools:
    reads_mapped: 900
    properly_paired: 1010
    secondary: 1020
In this case, since the default placement weighting is 1000, the reads_mapped will end up as the
leftmost column and the other two will and up as the final columns on the right of the table.
The columns are organised by either namespace or table ID, then column ID.
In the above example, Samtools is the namespace in the General Statistics table -
the text that is at the start of the tooltip. For custom tables, the ID may be easier to use.
Column titles
Sometimes it may be helpful to adjust the default table column header to display a different title. For example when running a module multiple times, or when different modules have columns with similar names.
To do this, use the approach described above to find the column Group and ID and combine with the table_columns_name config option.
For example, the following config will change the General Statistics column for FastQC from % GC to Percent of bases that are GC
table_columns_name:
  FastQC:
    percent_gc: "Percent of bases that are GC"
It will also work for module-specific tables by using the table ID instead of the module name, and specifying the column ID directly. See the Hiding columns section above for more details.
Conditional formatting
It’s possible to highlight values in tables based on their value. This is done using the table_cond_formatting_rules config setting.
Rules can be applied to every table in the report (all_columns), specific tables (table ID), or specific columns (column ID).
The default rules are as follows:
table_cond_formatting_rules:
  all_columns:
    pass:
      - s_eq: "pass"
      - s_eq: "true"
    warn:
      - s_eq: "warn"
      - s_eq: "unknown"
    fail:
      - s_eq: "fail"
      - s_eq: "false"
These make any table cells in the report that match the string pass or true have text with a green background, orange for warn, red for fail and so on.
There can be multiple tests for each style of formatting - if there is a match for any, it will be applied.
The following comparison operators are available:
s_eq- String exactly equals (case insensitive)s_contains- String contains (case insensitive)s_ne- String does not equal (case insensitive)eq- Value equalsne- Value does not equalgt- Value is greater thanlt- Value is less than
To have matches for a specific table or column, use that ID instead of all_columns.
For example, for the entire General Stats table:
table_cond_formatting_rules:
  general_stats_table:
    pass:
      - gt: 80
    warn:
      - lt: 80
    fail:
      - lt: 70
Or for one column in the General Stats table:
table_cond_formatting_rules:
  mqc-generalstats-uniquely_mapped_percent:
    pass:
      - gt: 80
    warn:
      - lt: 80
    fail:
      - lt: 70
Note that the formatting is done in a specific order - pass/warn/fail by default, so that anything matching both warn and fail will be formatted as fail for example. This can be customised with table_cond_formatting_colours (see below).
To find the unique ID for your table / column, right click it in a report and inspect it’s HTML (Inpsect in Chrome).
- Tables should look something like
<table id="general_stats_table" class="table table-condensed mqc_table" data-title="General Statistics">, wheregeneral_stats_tableis the ID. - Table cells should look something like
<td class="data-coloured mqc-generalstats-Assigned">, where themqc-generalstats-Assignedbit is the unique ID.
I know this isn’t the same method of IDs as above and it isn’t super easy to do. Sorry about that!
It’s possible to highlight matches in any number of colours. MultiQC comes with the following defaults:
table_cond_formatting_colours:
  - blue: "#337ab7"
  - lbue: "#5bc0de"
  - pass: "#5cb85c"
  - warn: "#f0ad4e"
  - fail: "#d9534f"
These can be overridden or added to with any string / CSS hex colour combinations you like. You can generate hex colour codes with lots of tools, for example htmlcolorcodes.com
Note that the different sets of rules are formatted in order. So if a value matches both pass and fail then it will be formatted as a fail
Number base (multiplier)
To make numbers in the General Statistics table easier to read and compare quickly,
MultiQC sometimes divides them by one million (typically read counts). If your
samples have very low read counts then this can result in the table showing
counts of 0.0, which isn’t very helpful.
To change this behaviour, you can customise three config variables in your MultiQC config. The defaults are as follows:
read_count_multiplier: 0.000001
read_count_prefix: "M"
read_count_desc: "millions"
So, to show thousands of reads instead of millions, change these to:
read_count_multiplier: 0.001
read_count_prefix: "K"
read_count_desc: "thousands"
The same options are also available for numbers of base pairs:
base_count_multiplier: 0.000001
base_count_prefix: "Mb"
base_count_desc: "millions"
And for long reads:
long_read_count_multiplier: 0.001
long_read_count_prefix: "K"
long_read_count_desc: "thousands"
Number formatting
By default, the interactive plots in MultiQC reports use spaces for thousands
separators and points for decimal places (e.g. 1 234 567.89). Different countries
have different preferences for this, so you can customise the two using a couple of
configuration parameters - decimalPoint_format and thousandsSep_format.
For example, the following config would result in the following alternative
number formatting: 1234567,89.
decimalPoint_format: ","
thousandsSep_format: ""
This formatting currently only applies to the interactive charts. It may be extended to apply elsewhere in the future (submit a new issue if you spot somewhere where you’d like it).
Bar plot legend positioning
By default, the legend for bar plots is placed on the right hand side of the plot. If you’d like to move it to the bottom, you can use the following config option:
barplot_legend_on_bottom: trueThis is not recommended to set up globally though, as it would look well only for medium-sized plot, but would start overlapping with the tick labels on shorter plots, or create a large gap on taller plots.
Troubleshooting
One tricky bit that caught me out whilst writing this is the different type casting between Python, YAML and Jinja2 templates. This is especially true when using an empty variable:
# Python
my_var = None
# YAML
my_var: null# Jinja2
if myvar is none # Note - Lower case!